
A Titanium electrode polarization curve shows how measured potential or voltage relates to current under a defined test protocol. A supplier's lower curve may look persuasive while using another area convention or resistance correction. That difference can disappear when the methods are aligned. Review the axes and experimental conditions before using a curve to select a coating.
1. What does a Titanium electrode polarization curve show?

A Titanium electrode polarization curve records current against potential or voltage as operating conditions are varied. It describes the tested system and protocol, not every possible application.
What was controlled during the test?
Identify the experiment. State whether current or potential was controlled and what voltage boundary was measured. A whole-cell curve and a referenced electrode curve answer different questions.
- Name the control mode.
- Describe the measured electrical boundary.
| Check | Decision |
|---|---|
| Whole-cell curve | Includes complete cell contributions |
| Referenced curve | Targets a defined electrode arrangement |
Classify the curve before interpreting its shape. Key Takeaway: A curve needs an experimental definition before it becomes comparison evidence.
2. Which Titanium electrode curve axes must be defined?
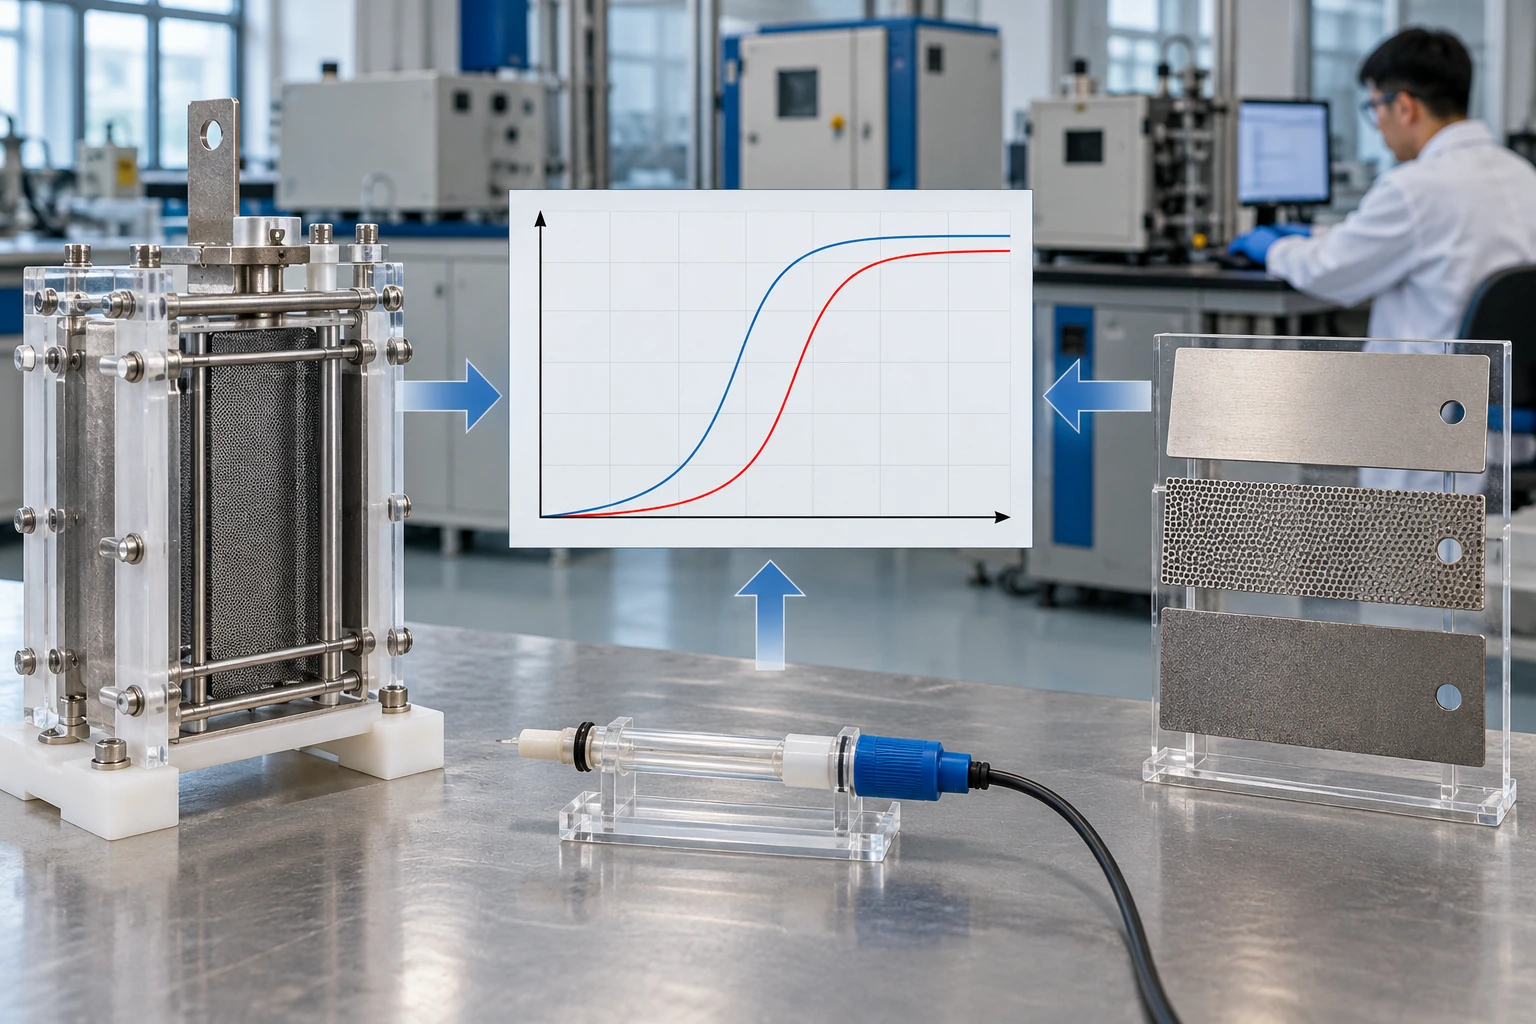
Titanium electrode curve axes must define current or current density, potential scale or cell voltage, and the chosen units. Missing area or reference information can invalidate an apparent advantage.
Are the axes really equivalent?
Read the labels before the lines. Check whether current density uses projected, coated or another declared area. Reference scale and sign convention should remain explicit throughout the report.
- Verify current and area units.
- Identify reference and voltage basis.
| Check | Decision |
|---|---|
| Similar-looking axes | May use different definitions |
| Aligned axes | Allow a more meaningful comparison |
Resolve unit differences before ranking samples. Key Takeaway: A lower plotted line is not automatically a better electrode.
3. Does scan rate change a Titanium electrode curve?

Scan rate or step timing can change a Titanium electrode curve because the interface may not reach the same state at every point. Transient and steady-state responses should not be mixed casually.
Did each point have time to stabilize?
Check the timing protocol. Ask for scan direction, rate or step duration and the stabilization rule. Keep reverse scans and conditioning history available when they reveal time-dependent behavior.
- Record the sweep or step method.
- State stabilization criteria.
| Check | Decision |
|---|---|
| Fast transient response | May include time-dependent effects |
| Defined steady-state points | Answer a different test question |
Compare curves generated with compatible timing. Key Takeaway: The route used to obtain a curve affects its meaning.
4. How does active area affect Titanium electrode curves?

Active-area definitions affect Titanium electrode current-density curves because the same current produces different normalized values under different area conventions. Coated, immersed and projected areas may differ.
Which area divides the current?
Trace the normalization to a drawing. Include masking and immersion details in a custom engineering review. Do not compare mesh developed area with plate projected area without stating that distinction.
- Record the active-area calculation.
- Keep test geometry with the result.
| Check | Decision |
|---|---|
| Current only | Unnormalized electrical quantity |
| Current density | Depends on the declared area |
Use a consistent normalization basis. Key Takeaway: An area convention can shift a curve without changing the measured current.
5. Should Titanium electrode curves include resistance correction?

Titanium electrode curves may include resistance correction, but the method and original data must remain available. Corrected and uncorrected curves cannot be treated as equivalent by default.
What was removed mathematically?
Request the raw trace. Review how resistance was measured and applied across the curve. A single correction assumption may not capture every changing operating condition.
- Retain uncorrected data.
- State correction scope and assumptions.
| Check | Decision |
|---|---|
| Raw curve | Observed system response |
| Corrected curve | Method-dependent interpretation |
Align correction methods before comparison. Key Takeaway: A useful corrected curve remains auditable against the raw measurement.
6. Can bubbles distort a Titanium electrode polarization curve?
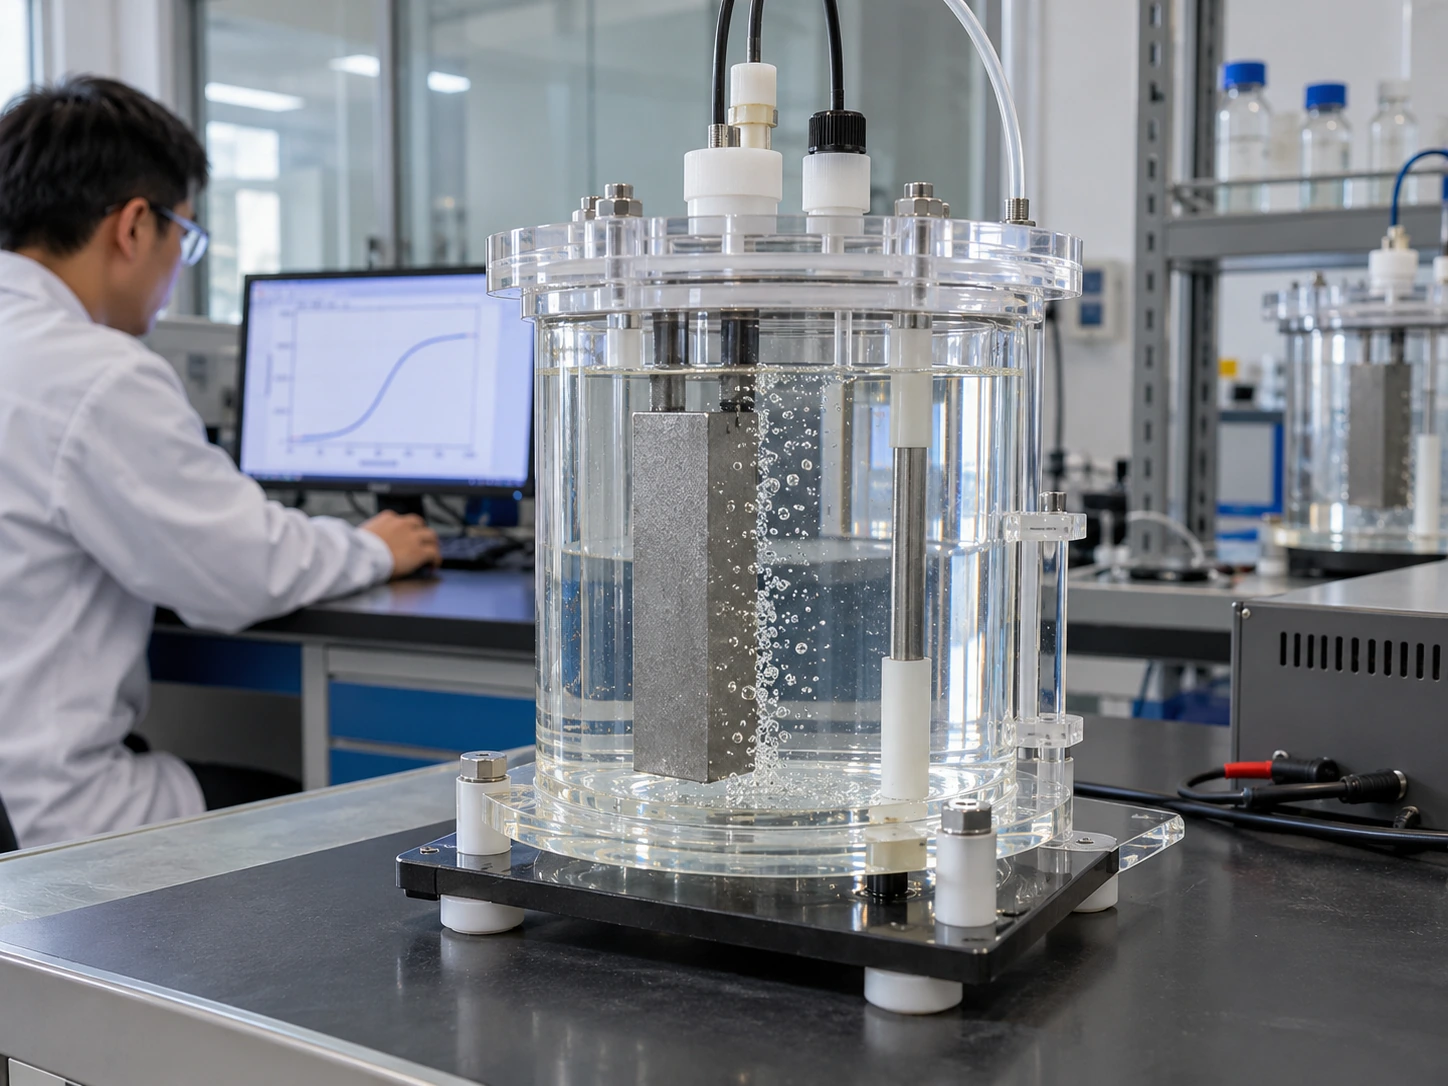
Bubbles can distort a Titanium electrode polarization response by changing coverage, transport and local resistance. Orientation, flow and gas handling belong in the test description.
Did gas behavior change during the sweep?
Keep the physical setup visible. Record flow, orientation and observed instability. Avoid attributing every curve bend to reaction kinetics when gas accumulation offers another explanation.
- Document flow and orientation.
- Retain observations of instability.
| Check | Decision |
|---|---|
| Stable gas removal | Supports a cleaner comparison |
| Changing gas coverage | Adds a physical confounder |
Check the operating scene alongside the electrical trace. Key Takeaway: Curve shape alone cannot separate kinetics from every transport effect.
7. Does a Titanium electrode curve predict product yield?

A Titanium electrode polarization curve does not directly establish useful product yield because current can support multiple reactions. Chemical output needs a separate appropriate measurement.
What did the current produce?
Measure the intended product. Use analytical results alongside the electrical curve when selectivity matters. A low potential at a chosen current does not establish that all charge formed useful output.
- Define the target product.
- Record relevant competing reactions.
| Check | Decision |
|---|---|
| Electrical curve | Describes current-voltage behavior |
| Product analysis | Evaluates useful chemical output |
Use complementary evidence for process selection. Key Takeaway: Electrical activity and useful product selectivity are different claims.
8. Can a Titanium electrode curve predict service life?

A short Titanium electrode polarization curve cannot predict service life without an independently justified durability relationship. It captures behavior during the test, not years of changing exposure.
What remains untested?
Separate performance from endurance. In water-treatment applications, retain distinct operating and durability acceptance requirements. Do not convert one attractive curve into a replacement-interval promise.
- State test duration and sample history.
- Request separate durability evidence where needed.
| Check | Decision |
|---|---|
| Short curve test | Condition-specific performance evidence |
| Durability program | Examines change with exposure |
Keep claims within the time and conditions tested. Key Takeaway: A polarization advantage does not establish a lifetime advantage.
9. How do you compare Titanium electrode supplier curves?

Supplier Titanium electrode curves should be compared only after chemistry, temperature, area, timing and correction methods are aligned. Unknown conditions should remain unresolved rather than silently assumed equal.
Which comparison details are missing?
Use a common reporting sheet. Request native data and sample identifiers, then check repeatability under the intended operating range. Focus on the relevant region rather than the most flattering point.
- Compare matching operating points.
- Include repeat measurements where justified.
| Check | Decision |
|---|---|
| Conditions aligned | Supports a focused ranking |
| Methods inconsistent | Needs clarification or retesting |
Choose evidence relevant to your actual duty. Key Takeaway: A fair curve comparison starts with aligned test methods.
10. What Titanium electrode curve data should you request?

A Titanium electrode curve package should include raw data, setup, sample identity and the intended purchasing decision. These records make the graph reproducible and keep its limits visible.
Ask for the test behind the graph
Send the operating region you need. When you contact us today, we can review electrode requirements and sample-test scope. We favor application-matched evidence over a curve presented without conditions.
- Provide chemistry and target current range.
- Name product and durability requirements separately.
| Check | Decision |
|---|---|
| Graph only | Limited technical value |
| Complete test package | Supports a reviewable decision |
Agree on the relevant comparison region. Key Takeaway: Use polarization data as one defined part of electrode qualification.
Frequently Asked Questions
Can I choose an anode from the lowest curve? Not until axes, chemistry, area and test methods are aligned.
How do I know if resistance correction was applied? Ask for the method and raw trace; a graph alone may not reveal it.
What's the best scan rate? Use a protocol appropriate to the test objective and system response, not a universal value.
Can I infer chlorine yield from current on a curve? No. Useful chemical output requires a suitable analytical measurement.
Can I infer electrode lifetime from a polarization curve? No. Durability needs separate evidence and a justified application relationship.