
A Titanium electrode cell's nominal residence time is its working liquid volume divided by flow, but that figure does not describe every parcel's path. Engineers need flow-distribution evidence before treating V/Q as electrochemical contact time.
1. How does V/Q estimate contact in a Titanium electrode cell?

A Titanium electrode cell's nominal residence estimate uses active liquid volume divided by volumetric flow. V/Q gives a bookkeeping average, not the contact history of every water parcel.
Use V over Q as a starting estimate
V/Q uses defined liquid volume and flow, but cannot show bypass or low-exchange regions. Call it a nominal estimate. State which tanks, manifolds, and channels belong inside that boundary.
- Define working liquid volume rather than using vessel shell capacity.
- State whether recirculation flow or net feed flow supplies Q.
| Check | Decision |
|---|---|
| V/Q | Nominal average estimate |
| Measured exposure | Flow path and reaction history |
A correct calculation can still describe the wrong process boundary. Key Takeaway: Label V/Q as nominal until distribution evidence supports more.
2. Why can actual distribution differ around a Titanium electrode?
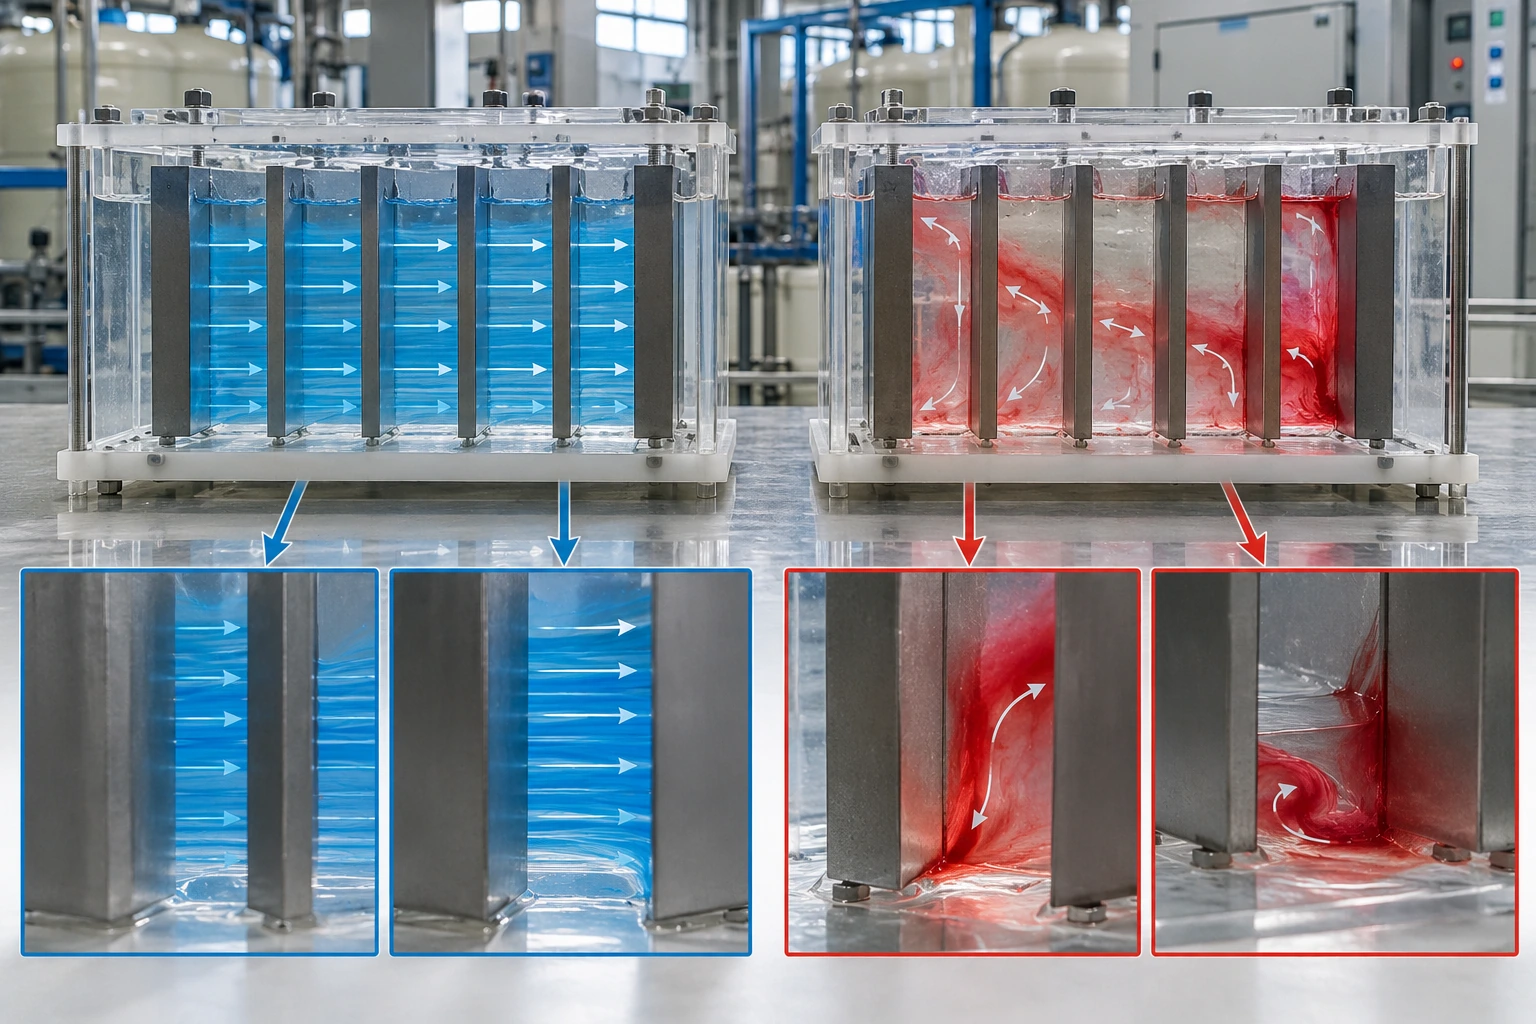
A Titanium electrode cell can show a residence-time distribution that differs from its nominal average because liquid follows unequal paths. Inlet geometry, plate spacing, and outlet location shape those paths.
Compare ideal flow with actual distribution
Ideal plug flow gives parcels similar passage times, while backmixing, short-circuit paths, and stagnant pockets create a spread. Look for early arrival and long tails. A single mean value hides both conditions, which can change reaction exposure across the stream.
- Review how inlet jets and outlet placement interact with the electrode stack.
- Inspect supports, corners, and gaps that may hold low-exchange liquid.
| Check | Decision |
|---|---|
| Short path | Early outlet arrival |
| Dead zone | Slow liquid exchange |
A wide distribution can leave some parcels underexposed while others remain longer. Key Takeaway: Discuss flow distribution alongside nominal tank volume.
3. What short-circuiting looks like around a Titanium electrode cell?
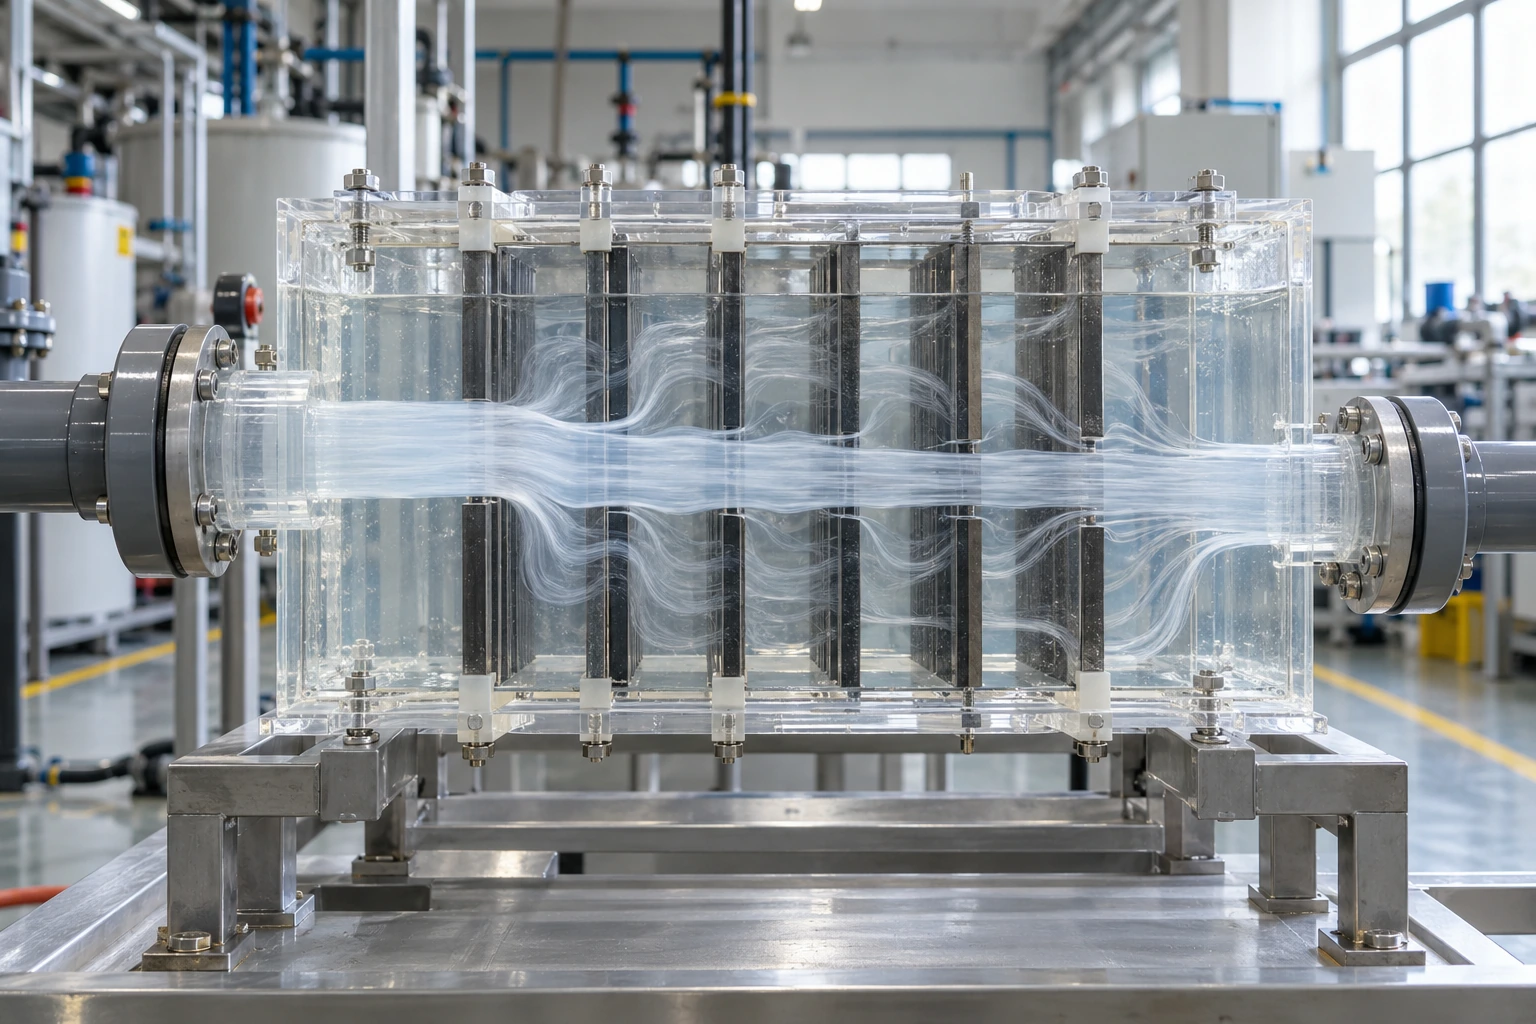
A Titanium electrode reactor short-circuits when a portion of flow reaches the outlet along a faster path than surrounding liquid. This bypass can reduce exposure without changing the V/Q calculation.
Find the fast flow path
An inlet jet, wall gap, or low-resistance channel may carry liquid quickly toward an outlet; sparse sampling can hide early tracer breakthrough. Map the whole tracer response. Compare timed inlet and outlet signals under stable flow.
- Review inlet direction, outlet location, and edge clearances in the assembled cell.
- Collect enough timed outlet samples to resolve early arrival and the later tail.
| Check | Decision |
|---|---|
| Early breakthrough | Possible bypass path |
| Late tail | Slowly exchanged volume |
A fast path can matter even when average flow and volume look correct. Key Takeaway: Test the assembled hydraulic path rather than relying on a layout sketch.
4. How do dead zones change Titanium electrode contact?
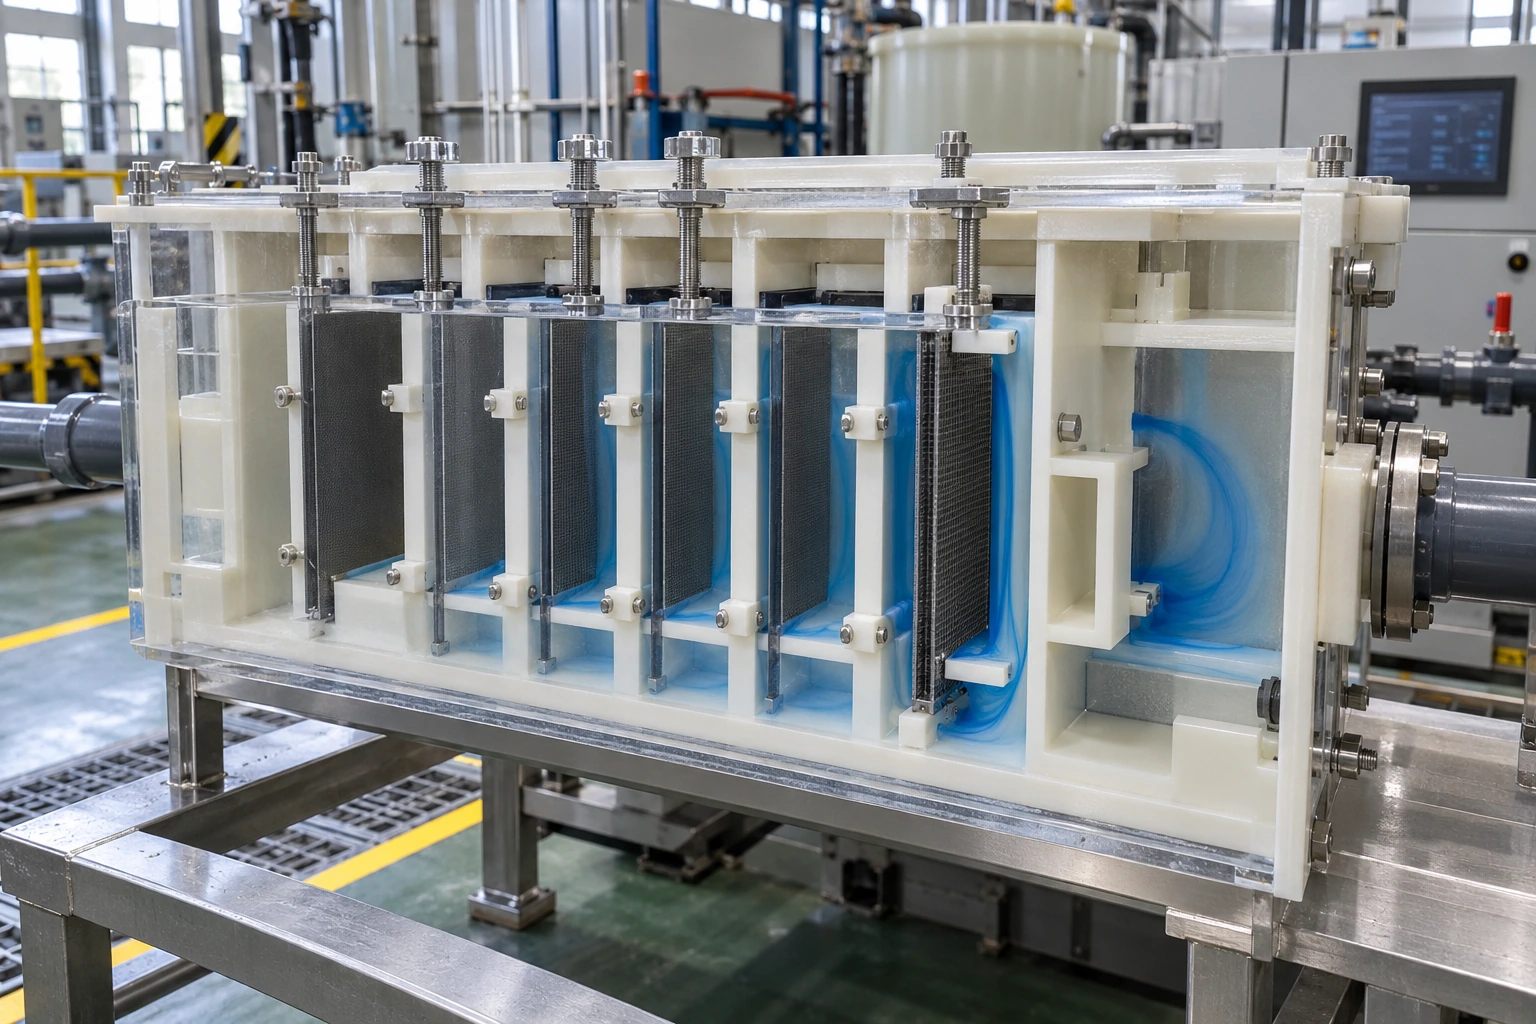
A Titanium electrode dead zone holds liquid with weak exchange near corners, supports, or sheltered plate gaps. That volume enters V but contributes little active flow.
Treat stagnant pockets as lost exchange, not extra contact
A stagnant pocket holds liquid around corners, supports, or sheltered gaps; counted volume may exceed active flow volume. Check liquid exchange, not volume. A custom electrode review can review supports and gaps against planned operating conditions.
- Identify corners and hardware that block circulation between electrode faces.
- Compare the hydraulic layout with actual deposits and operating orientation.
| Check | Decision |
|---|---|
| Counted volume | May include low-exchange pockets |
| Active exchange | Needs flow evidence |
Volume inside a shell does not automatically equal useful electrochemical contact. Key Takeaway: Do not count stagnant regions as effective reaction volume without evidence.
5. Which evidence describes Titanium electrode flow distribution?
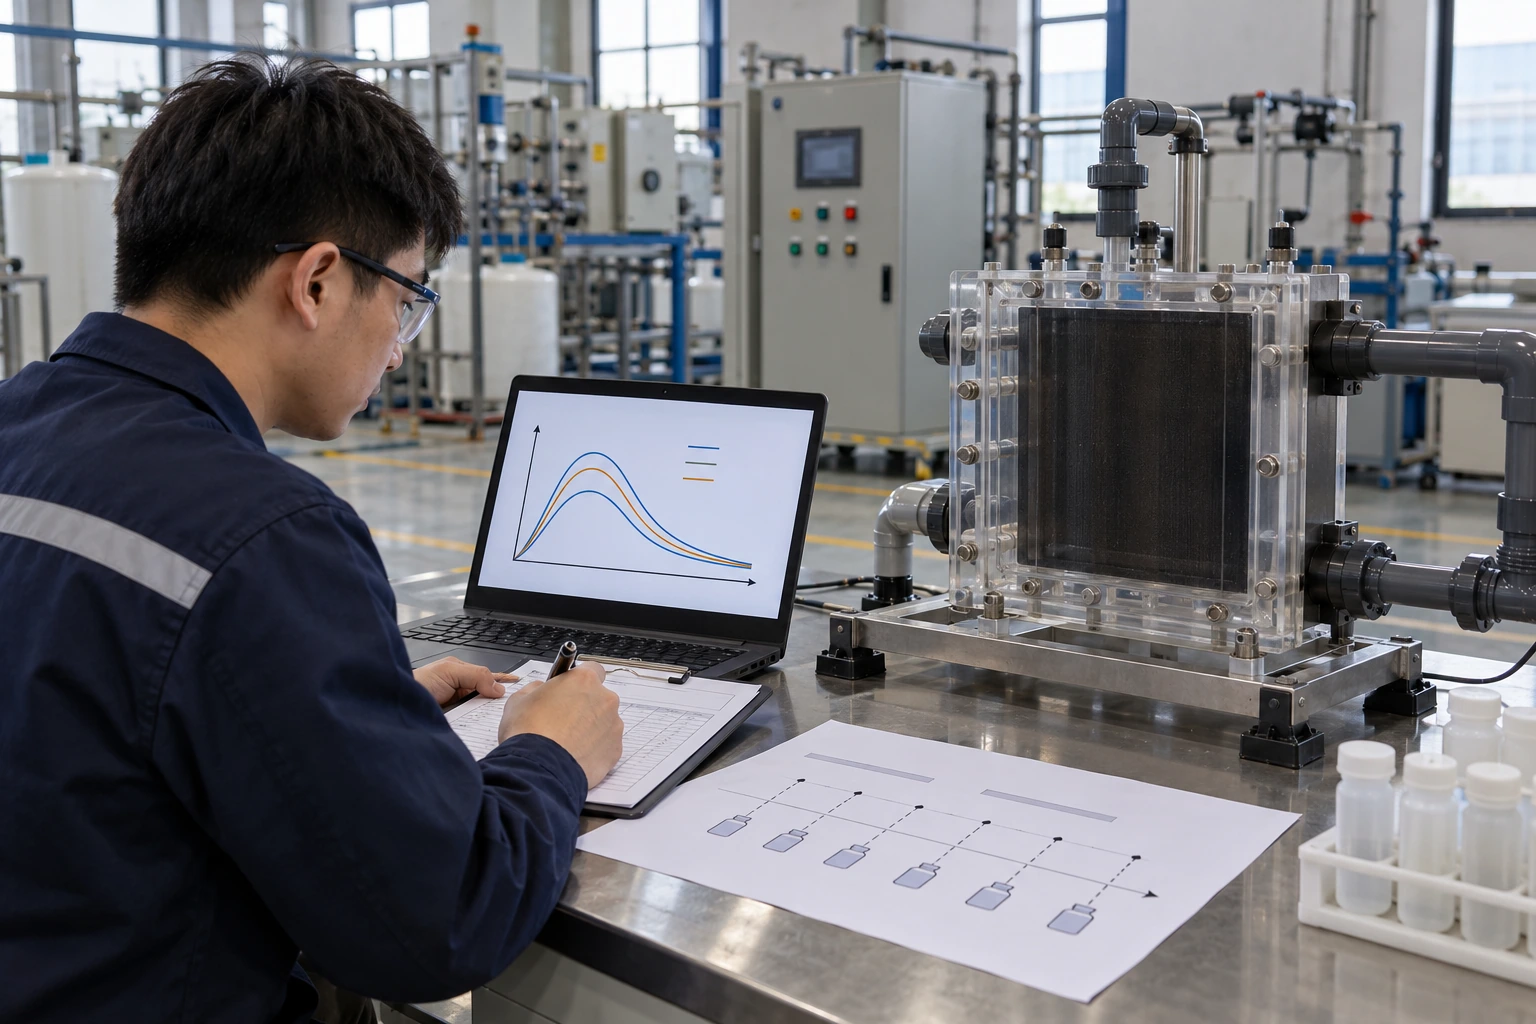
A Titanium electrode flow assessment can use residence-time distribution (RTD) data to describe how liquid passes through a reactor. A tracer response gives more detail than V/Q alone.
Use a tracer as a hydraulic probe
A pulse or step tracer follows a nonreactive signal from inlet to outlet; tracer and detector must not disrupt flow. Test under stable hydraulic conditions. Report injection, measurement point, flow state, and signal delay.
- Choose a tracer compatible with process water and measurement equipment.
- Record stable operating flow before interpreting the response curve.
| Check | Decision |
|---|---|
| V/Q | Geometry-based average |
| RTD test | Measured time distribution |
A tracer test characterizes hydraulics, not pollutant reaction kinetics. Key Takeaway: Keep flow measurement and tracer method with the resulting curve.
6. Can a tracer test reveal Titanium electrode channeling?
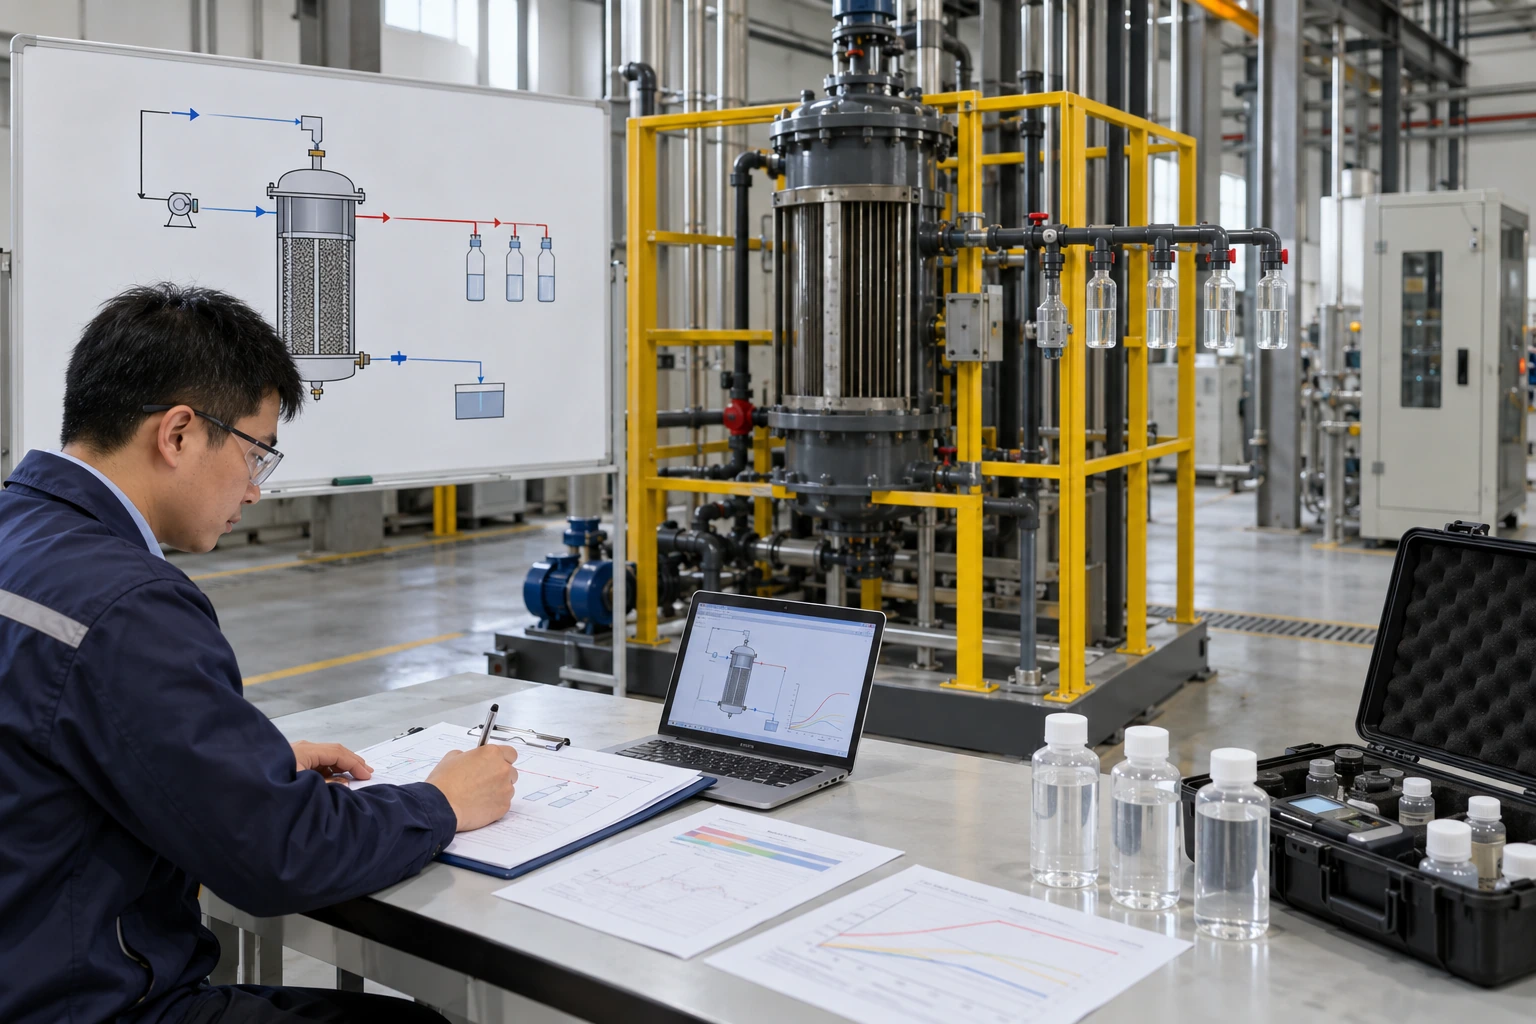
A Titanium electrode tracer study can reveal channeling when the outlet signal arrives earlier or spreads differently than an idealized model predicts. Sampling design determines whether that pattern is visible.
Make the outlet record dense enough to see change
A sparse sample schedule may miss a narrow peak or blur a long tail; probe location and sensor response also affect interpretation. Check the full instrument response. Compare measured curves with a baseline before changing the model.
- Select sample intervals that can distinguish rapid breakthrough from the mean response.
- Document probe placement and sensor response alongside tracer data.
| Check | Decision |
|---|---|
| Early samples | Resolve bypass response |
| Tail samples | Resolve slow exchange |
A missed flow feature can look like a clean but misleading average. Key Takeaway: Plan tracer sampling around the shortest and longest paths of interest.
7. How do operating changes shift a Titanium electrode RTD?
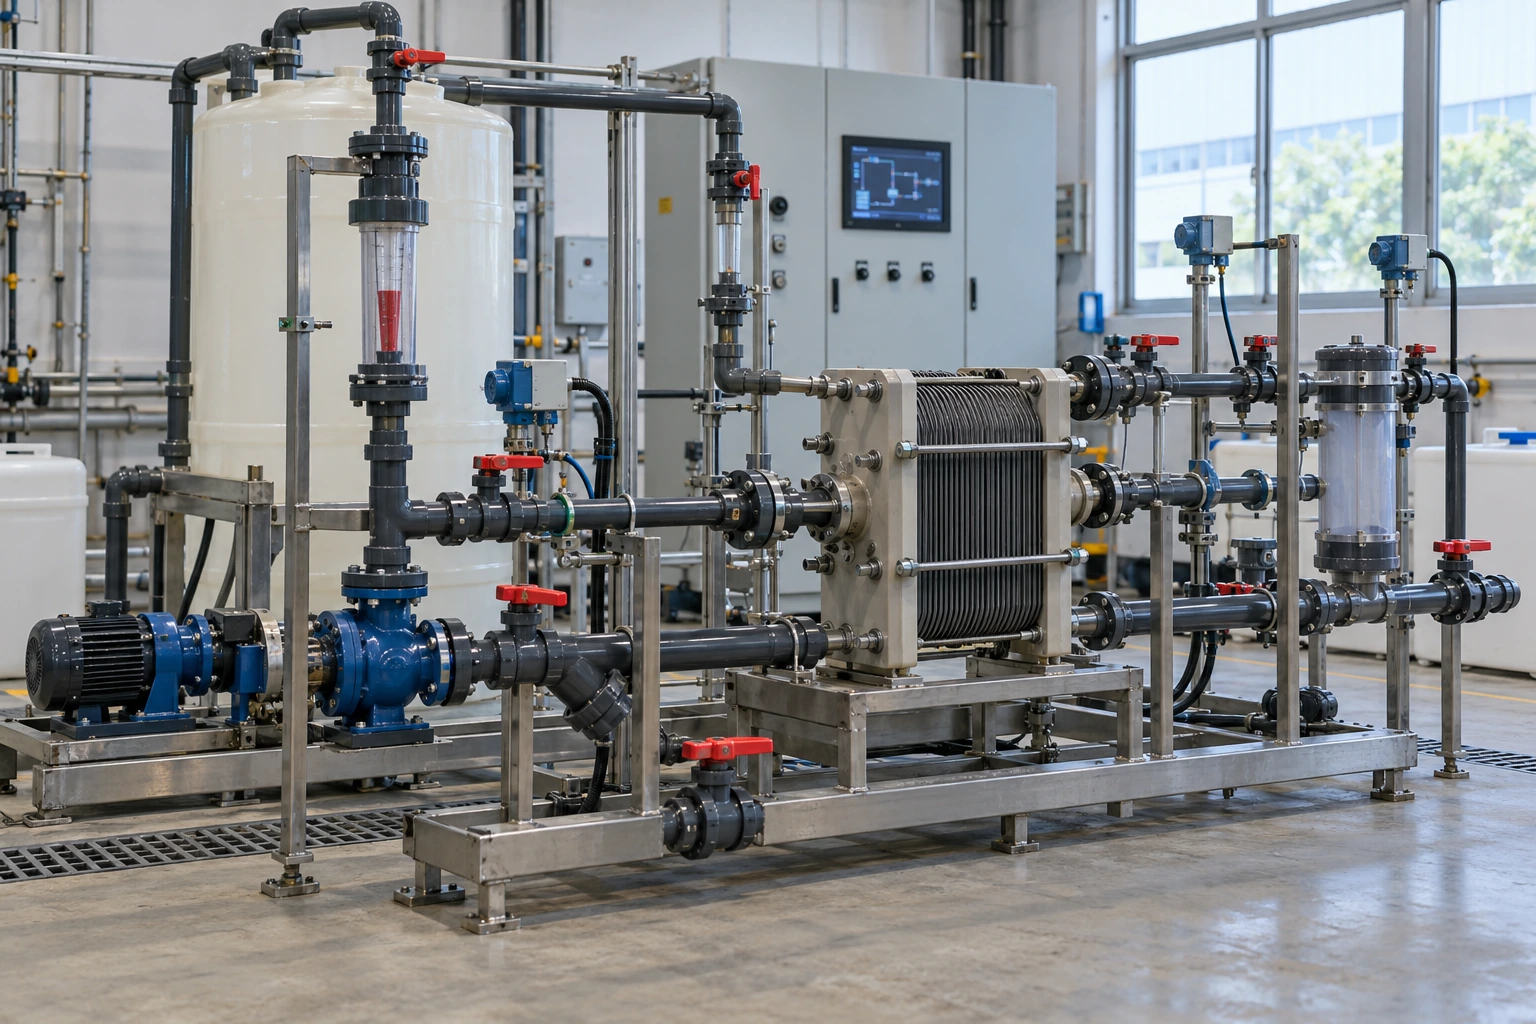
A Titanium electrode RTD can shift when flow, gas generation, viscosity, solids, or operating orientation changes. A pilot curve applies only within its tested conditions.
Repeat flow evidence when operating conditions shift
A pump change can alter recirculation and pressure loss; chemistry can also change viscosity or gas behavior. Keep every test condition attached. For hypochlorite-generation systems, separate generator passage from downstream contact exposure.
- Record feed properties, flow, cell orientation, and gas condition during a hydraulic test.
- Repeat characterization after material changes to cell geometry or operating mode.
| Check | Decision |
|---|---|
| Generator passage | Electrode-zone flow |
| Contact basin | Downstream exposure |
One RTD curve cannot represent every flow condition or process stage. Key Takeaway: Apply hydraulic results only to the cell and conditions actually tested.
8. What does modeling add to Titanium electrode flow data?
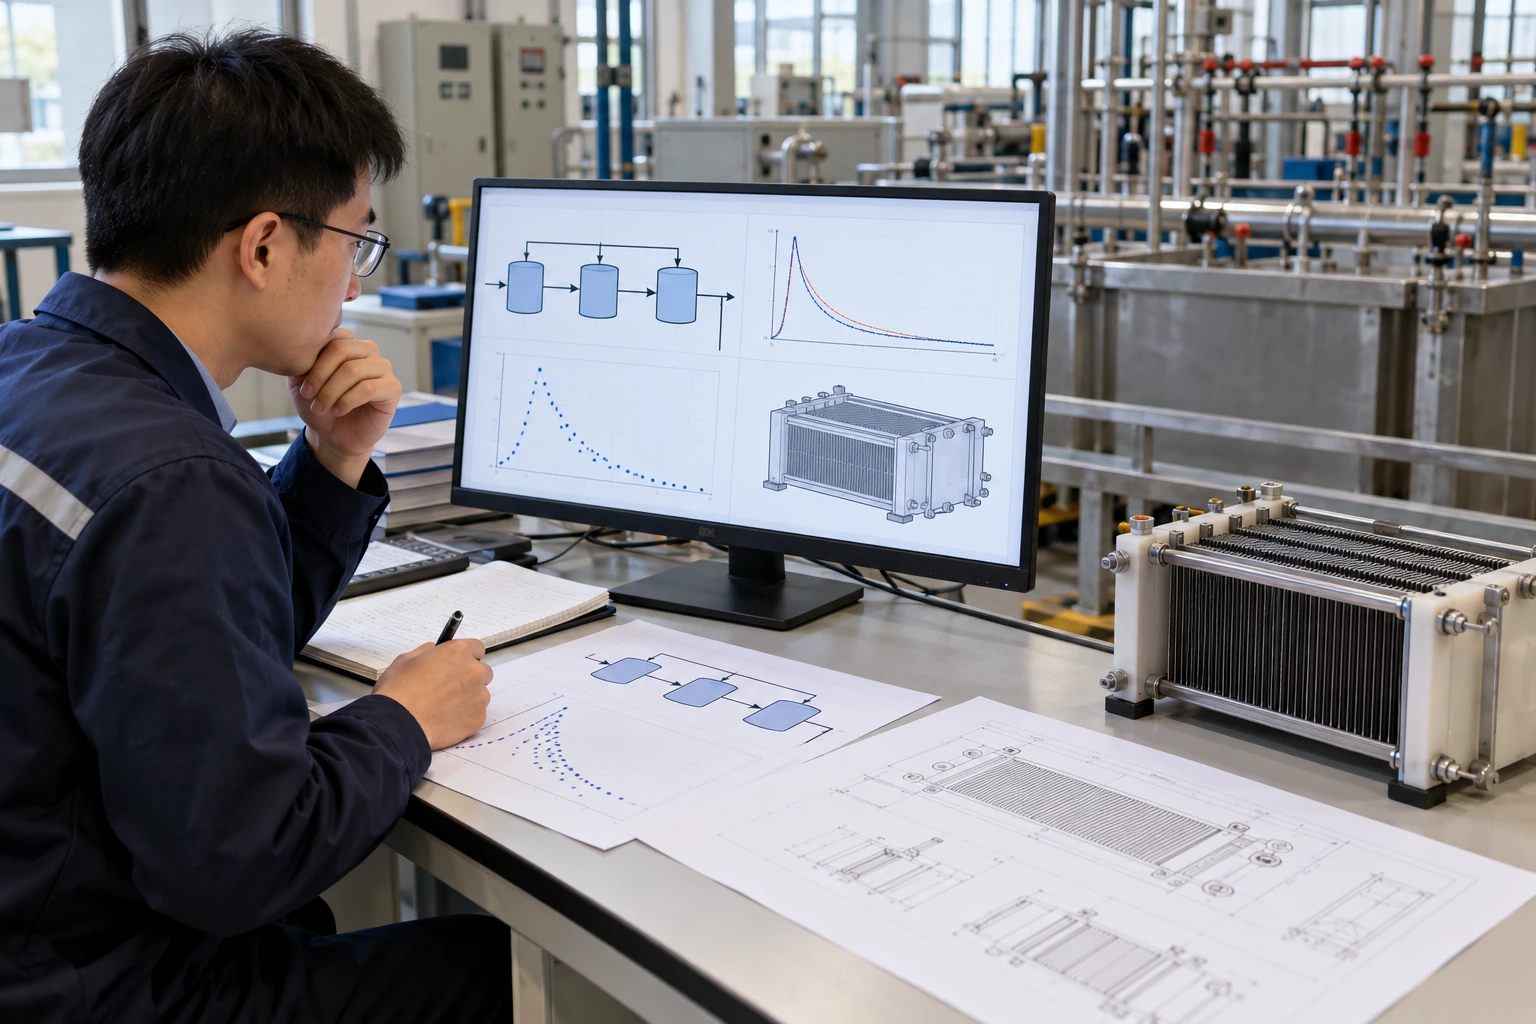
A Titanium electrode model can help interpret RTD data through tanks-in-series or dead-zone descriptions, but its parameters summarize a measured pattern. They do not prove a physical flow path by themselves.
Use models as compact descriptions
For hypochlorite-generation systems, a model can compare design alternatives or connect hydrodynamics with reaction kinetics. Keep the model fit honest. Check whether one parameter set describes early breakthrough and long retention, then validate another operating case.
- Show the measured curve beside any fitted model.
- State which operating cases were used for calibration and validation.
| Check | Decision |
|---|---|
| Fitted model | Summarizes observed behavior |
| Tracer data | Grounds interpretation |
A neat curve fit may still mask local geometry that needs redesign. Key Takeaway: Use modeling to guide another test or drawing review.
9. How should engineers report Titanium electrode contact?
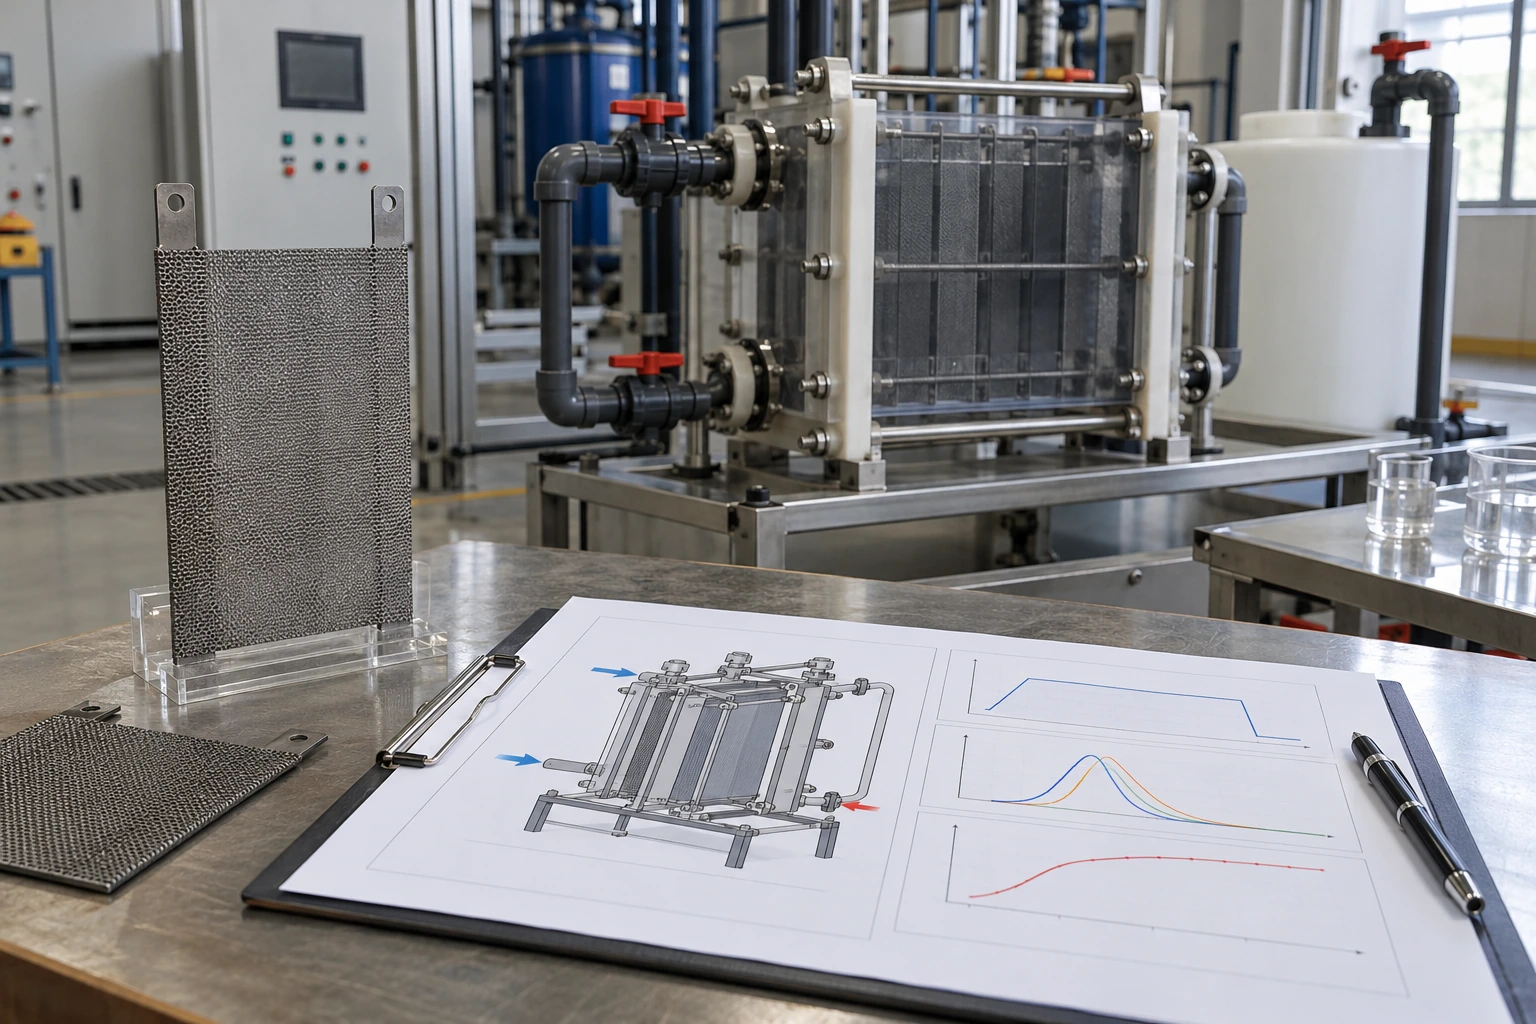
A Titanium electrode contact assumption should report nominal V/Q separately from measured distribution and reaction results. Pair volume and flow across the same boundary.
Report three different kinds of evidence
Match volume and flow boundaries: active cell volume pairs with cell-throughflow; system residence uses system inventory with net feed. Keep each boundary consistent throughout. Track recycle separately and use tracer data to describe actual paths.
- Use active cell volume with cell-throughflow for a cell-passage estimate.
- Use whole-system inventory with net feed for system residence; report recycle flow separately.
| Check | Decision |
|---|---|
| Cell passage | Active cell volume with cell-throughflow |
| Whole system | System inventory with net feed; recycle separate |
Separate evidence keeps a nominal average from being mistaken for measured exposure. Key Takeaway: Label every contact-time number by its measurement basis.
10. What should buyers provide for Titanium electrode flow review?
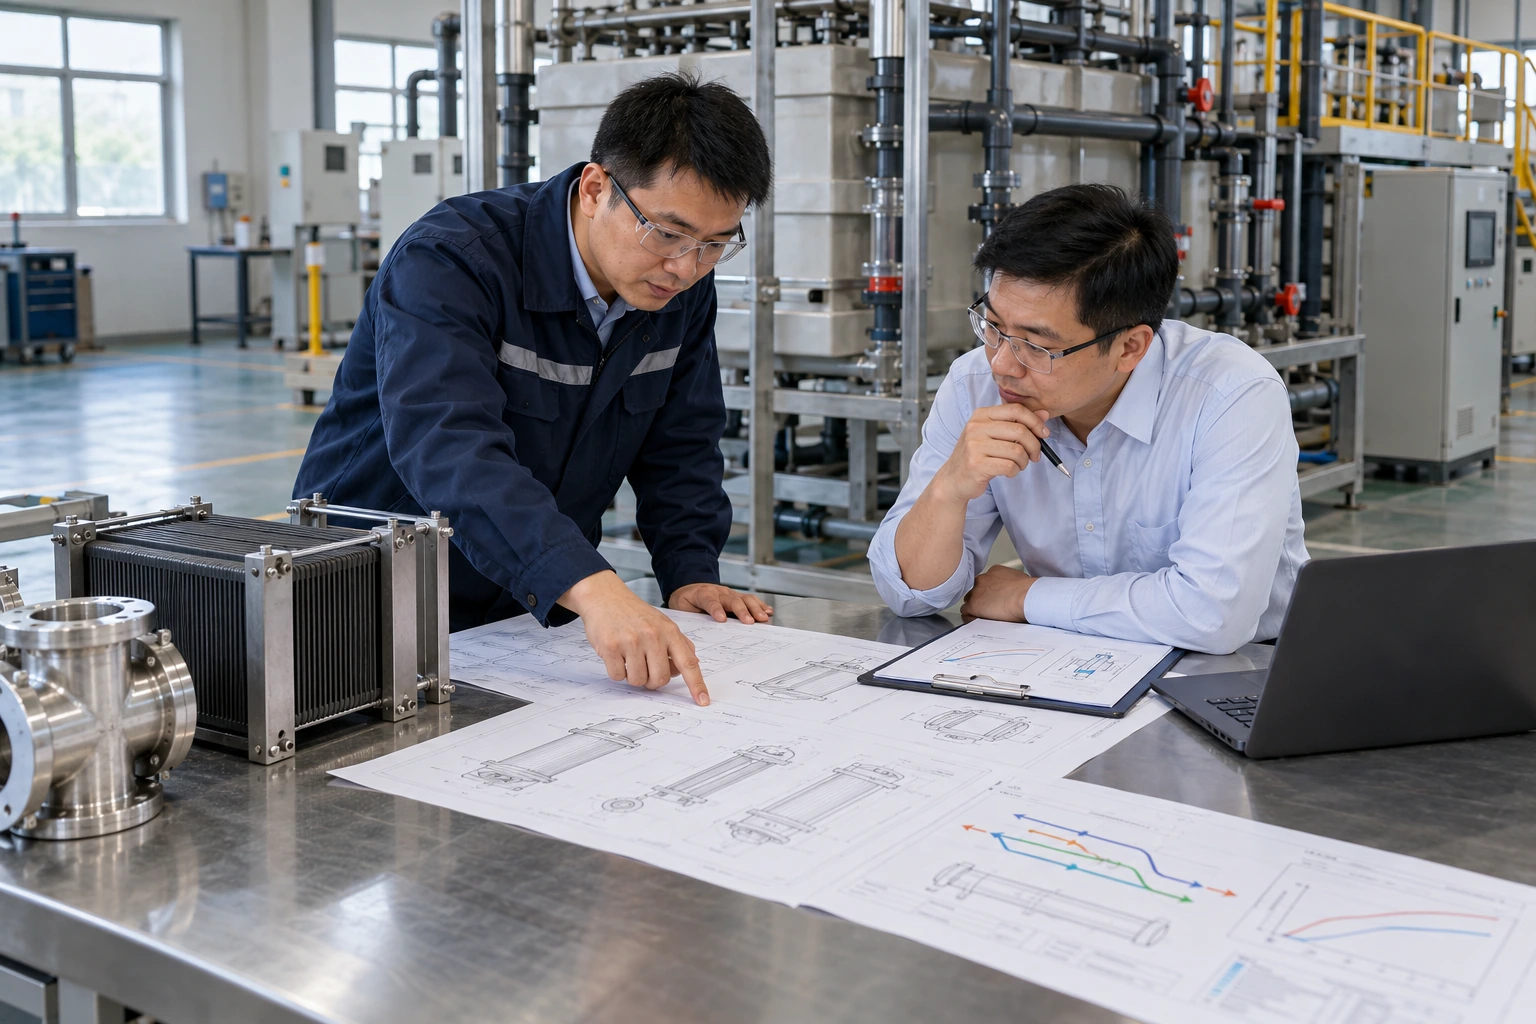
A Titanium electrode flow review needs defined liquid volumes, cell-throughflow, net feed, recycle flow, and any tracer results. ARY Titanium can review drawing-based electrode fit within its supplied product scope.
Send geometry and flow records together
Send active cell volume, cell-throughflow, system inventory, net feed, recycle flow, drawings, orientation, and sample locations; label V/Q and tracer basis. Make the measurement boundary visible. To request a product review, contact us today with those records and the cell drawing.
- Define whether Q means cell-throughflow or net system feed.
- Include active cell volume, whole-system inventory, and recycle-flow data with each estimate.
| Check | Decision |
|---|---|
| Cell passage | Active cell volume with cell-throughflow |
| Whole system | System inventory with net feed; recycle separate |
An electrode drawing review cannot certify reactor contact time without process evidence. Key Takeaway: Request a scope review with measured hydraulic information where available.
Frequently Asked Questions
Can I treat V/Q as actual contact time? No; V/Q gives a nominal average, while short paths and dead zones create a different distribution.
What's the best way to measure a flow cell's residence distribution? Run a compatible tracer study under stable flow and record an outlet response over time.
How do I know if a cell has short-circuiting? Look for early tracer arrival relative to expected flow, then inspect inlet, outlet, and channel geometry.
Can I use a model instead of a tracer test? A model can guide design, but measured flow data should ground its assumptions and validate predictions.
How do I know if an old RTD curve still applies? Compare operating flow, feed properties, cell geometry, and orientation with conditions used during the original test.